Different ways to load an input graph#
We recommend using the GML graph format to load a graph. You can also use the DOT format, which requires additional dependencies (either pydot or pygraphviz).
DoWhy supports both loading a graph as a string, or as a file (with the extensions ‘gml’ or ‘dot’).
Below is an example showing the different ways of loading the same graph.
[1]:
import os, sys
import random
sys.path.append(os.path.abspath("../../../"))
[2]:
import numpy as np
import pandas as pd

import dowhy
dowhy.enable_notebook_rendering()
from dowhy import CausalModel
from IPython.display import Image, display
I. Generating dummy data#
We generate some dummy data for three variables: X, Y and Z.
[3]:
z=[i for i in range(10)]
random.shuffle(z)
df = pd.DataFrame(data = {'Z': z, 'X': range(0,10), 'Y': range(0,100,10)})
df
[3]:
| Z | X | Y | |
|---|---|---|---|
| 0 | 0 | 0 | 0 |
| 1 | 5 | 1 | 10 |
| 2 | 9 | 2 | 20 |
| 3 | 7 | 3 | 30 |
| 4 | 3 | 4 | 40 |
| 5 | 8 | 5 | 50 |
| 6 | 4 | 6 | 60 |
| 7 | 2 | 7 | 70 |
| 8 | 6 | 8 | 80 |
| 9 | 1 | 9 | 90 |
II. Loading GML or DOT graphs#
GML format#
[4]:
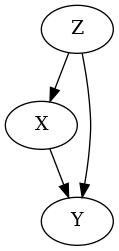
# With GML string
model=CausalModel(
        data = df,
        treatment='X',
        outcome='Y',
        graph="""graph[directed 1 node[id "Z" label "Z"]
                    node[id "X" label "X"]
                    node[id "Y" label "Y"]
                    edge[source "Z" target "X"]
                    edge[source "Z" target "Y"]
                    edge[source "X" target "Y"]]"""

        )
model.view_model()


display(Image(filename="causal_model.png"))


[5]:
# With GML file
model=CausalModel(
        data = df,
        treatment='X',
        outcome='Y',
        graph="../example_graphs/simple_graph_example.gml"
        )
model.view_model()


display(Image(filename="causal_model.png"))


DOT format#
[6]:
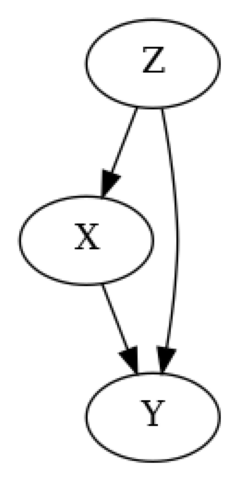
# With DOT string
model=CausalModel(
        data = df,
        treatment='X',
        outcome='Y',
        graph="digraph {Z -> X;Z -> Y;X -> Y;}"
        )
model.view_model()

from IPython.display import Image, display
display(Image(filename="causal_model.png"))

[7]:
# With DOT file
model=CausalModel(
        data = df,
        treatment='X',
        outcome='Y',
        graph="../example_graphs/simple_graph_example.dot"
        )
model.view_model()


display(Image(filename="causal_model.png"))