

DoWhy | An end-to-end library for causal inference
Introducing DoWhy and the 4 steps of causal inference | Microsoft Research Blog | Arxiv Paper | Slides
Read the docs | Try it online!

Case Studies using DoWhy: Hotel booking cancellations | Effect of customer loyalty programs | Optimizing article headlines | Effect of home visits on infant health (IHDP)
As computing systems are more frequently and more actively intervening in societally critical domains such as healthcare, education, and governance, it is critical to correctly predict and understand the causal effects of these interventions. Without an A/B test, conventional machine learning methods, built on pattern recognition and correlational analyses, are insufficient for causal reasoning.
Much like machine learning libraries have done for prediction, “DoWhy” is a Python library that aims to spark causal thinking and analysis. DoWhy provides a unified interface for causal inference methods and automatically tests many assumptions, thus making inference accessible to non-experts.
For a quick introduction to causal inference, check out amit-sharma/causal-inference-tutorial. We also gave a more comprehensive tutorial at the ACM Knowledge Discovery and Data Mining (KDD 2018) conference: causalinference.gitlab.io/kdd-tutorial.
Documentation for DoWhy is available at microsoft.github.io/dowhy.
Contents
The need for causal inference
Predictive models uncover patterns that connect the inputs and outcome in observed data. To intervene, however, we need to estimate the effect of changing an input from its current value, for which no data exists. Such questions, involving estimating a counterfactual, are common in decision-making scenarios.
- Will it work?
Does a proposed change to a system improve people’s outcomes?
- Why did it work?
What led to a change in a system’s outcome?
- What should we do?
What changes to a system are likely to improve outcomes for people?
- What are the overall effects?
How does the system interact with human behavior?
What is the effect of a system’s recommendations on people’s activity?
Answering these questions requires causal reasoning. While many methods exist for causal inference, it is hard to compare their assumptions and robustness of results. DoWhy makes three contributions,
Provides a principled way of modeling a given problem as a causal graph so that all assumptions are explicit.
Provides a unified interface for many popular causal inference methods, combining the two major frameworks of graphical models and potential outcomes.
Automatically tests for the validity of assumptions if possible and assesses the robustness of the estimate to violations.
To see DoWhy in action, check out how it can be applied to estimate the effect of a subscription or rewards program for customers [Rewards notebook] and for implementing and evaluating causal inference methods on benchmark datasets like the Infant Health and Development Program (IHDP) dataset, Infant Mortality (Twins) dataset, and the Lalonde Jobs dataset.
Installation
DoWhy support Python 3.5+. To install, you can use pip or conda.
Latest Release
Install the latest release using pip.
pip install dowhy
Install the latest release using conda.
conda install -c conda-forge dowhy
If you face “Solving environment” problems with conda, then try conda update --all and then install dowhy. If that does not work, then use conda config --set channel_priority false and try to install again. If the problem persists, please add your issue here.
Development Version
If you prefer the latest dev version, clone this repository and run the following command from the top-most folder of the repository.
pip install -e .
Requirements
DoWhy requires the following packages:
numpy
scipy
scikit-learn
pandas
networkx (for analyzing causal graphs)
matplotlib (for general plotting)
sympy (for rendering symbolic expressions)
If you face any problems, try installing dependencies manually.
pip install -r requirements.txt
Optionally, if you wish to input graphs in the dot format, then install pydot (or pygraphviz).
For better-looking graphs, you can optionally install pygraphviz. To proceed, first install graphviz and then pygraphviz (on Ubuntu and Ubuntu WSL).
sudo apt install graphviz libgraphviz-dev graphviz-dev pkg-config
## from https://github.com/pygraphviz/pygraphviz/issues/71
pip install pygraphviz --install-option="--include-path=/usr/include/graphviz" \
--install-option="--library-path=/usr/lib/graphviz/"
Keep in mind that pygraphviz installation can be problematic on the latest versions of Python3. Tested to work with Python 3.5.
Sample causal inference analysis in DoWhy
Most DoWhy analyses for causal inference take 4 lines to write, assuming a pandas dataframe df that contains the data:
from dowhy import CausalModel
import dowhy.datasets

# Load some sample data
data = dowhy.datasets.linear_dataset(
    beta=10,
    num_common_causes=5,
    num_instruments=2,
    num_samples=10000,
    treatment_is_binary=True)
DoWhy supports two formats for providing the causal graph: gml (preferred) and dot. After loading in the data, we use the four main operations in DoWhy: model, estimate, identify and refute:
# I. Create a causal model from the data and given graph.
model = CausalModel(
    data=data["df"],
    treatment=data["treatment_name"],
    outcome=data["outcome_name"],
    graph=data["gml_graph"])

# II. Identify causal effect and return target estimands
identified_estimand = model.identify_effect()

# III. Estimate the target estimand using a statistical method.
estimate = model.estimate_effect(identified_estimand,
                                 method_name="backdoor.propensity_score_matching")

# IV. Refute the obtained estimate using multiple robustness checks.
refute_results = model.refute_estimate(identified_estimand, estimate,
                                       method_name="random_common_cause")
DoWhy stresses on the interpretability of its output. At any point in the analysis, you can inspect the untested assumptions, identified estimands (if any) and the estimate (if any). Here’s a sample output of the linear regression estimator.
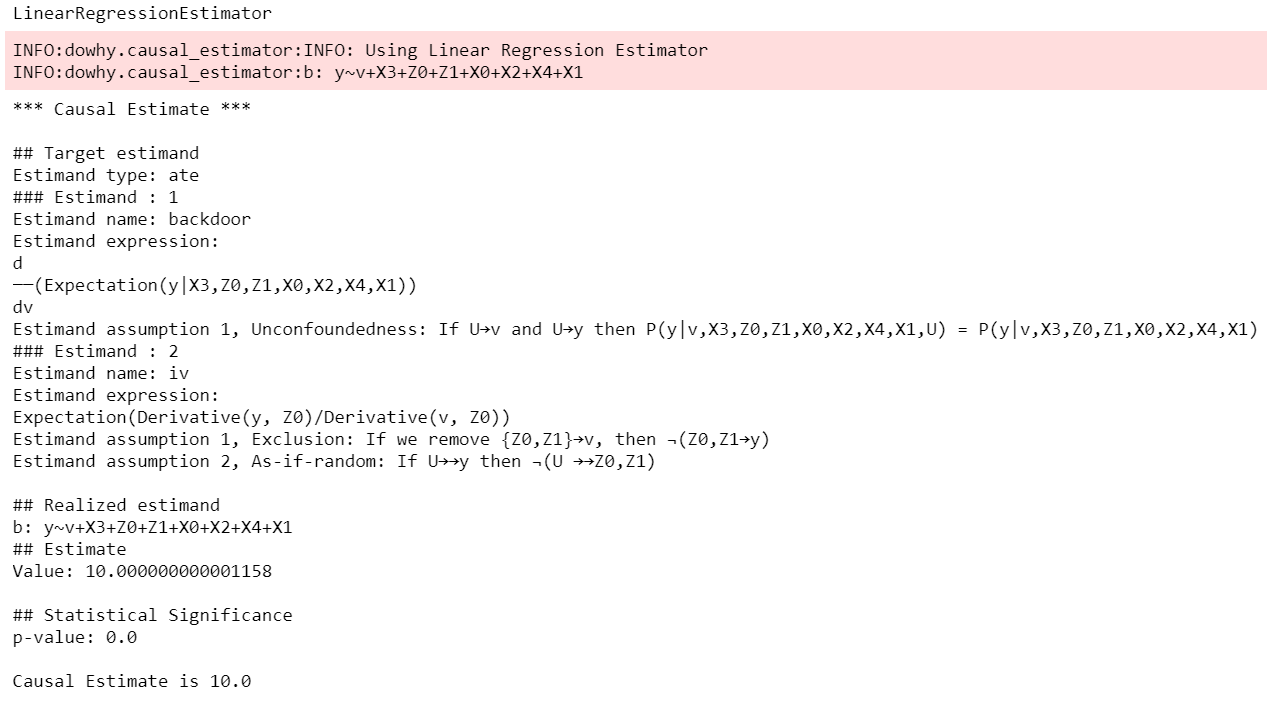
For a full code example, check out the Getting Started with DoWhy notebook. You can also use estimation methods from other libraries such as EconML and CausalML, as shown in the Conditional Treatment Effects notebook. For more examples of using DoWhy, check out the Jupyter notebooks in docs/source/example_notebooks or try them online at Binder.
A high-level Pandas API
We’ve made an even simpler API for dowhy which is a light layer on top of the standard one. The goal is to make causal analysis much more like regular exploratory analysis. To use this API, simply
import dowhy.api. This will magically add the causal namespace to your
pandas.DataFrame s. Then,
you can use the namespace as follows.
import dowhy.api
import dowhy.datasets
data = dowhy.datasets.linear_dataset(beta=5,
num_common_causes=1,
num_instruments = 0,
num_samples=1000,
treatment_is_binary=True)
# data['df'] is just a regular pandas.DataFrame
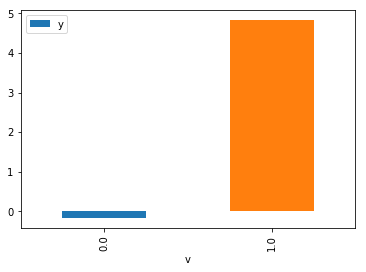
data['df'].causal.do(x='v0', # name of treatment variable
variable_types={'v0': 'b', 'y': 'c', 'W0': 'c'},
outcome='y',
common_causes=['W0']).groupby('v0').mean().plot(y='y', kind='bar')
For some methods, the variable_types field must be specified. It should be a dict, where the keys are
variable names, and values are ‘o’ for ordered discrete, ‘u’ for un-ordered discrete, ‘d’ for discrete, or ‘c’
for continuous.
Note:If the variable_types is not specified we make use of the following implicit conversions:
int -> 'c'
float -> 'c'
binary -> 'b'
category -> 'd'
Currently we have not added support for timestamps.
The do method in the causal namespace generates a random sample from $P(outcome|do(X=x))$ of the
same length as your data set, and returns this outcome as a new DataFrame. You can continue to perform
the usual DataFrame operations with this sample, and so you can compute statistics and create plots
for causal outcomes!
The do method is built on top of the lower-level dowhy objects, so can still take a graph and perform
identification automatically when you provide a graph instead of common_causes.
For more details, check out the Pandas API notebook or the Do Sampler notebook.
Graphical Models and Potential Outcomes: Best of both worlds
DoWhy builds on two of the most powerful frameworks for causal inference: graphical models and potential outcomes. It uses graph-based criteria and do-calculus for modeling assumptions and identifying a non-parametric causal effect. For estimation, it switches to methods based primarily on potential outcomes.
A unifying language for causal inference
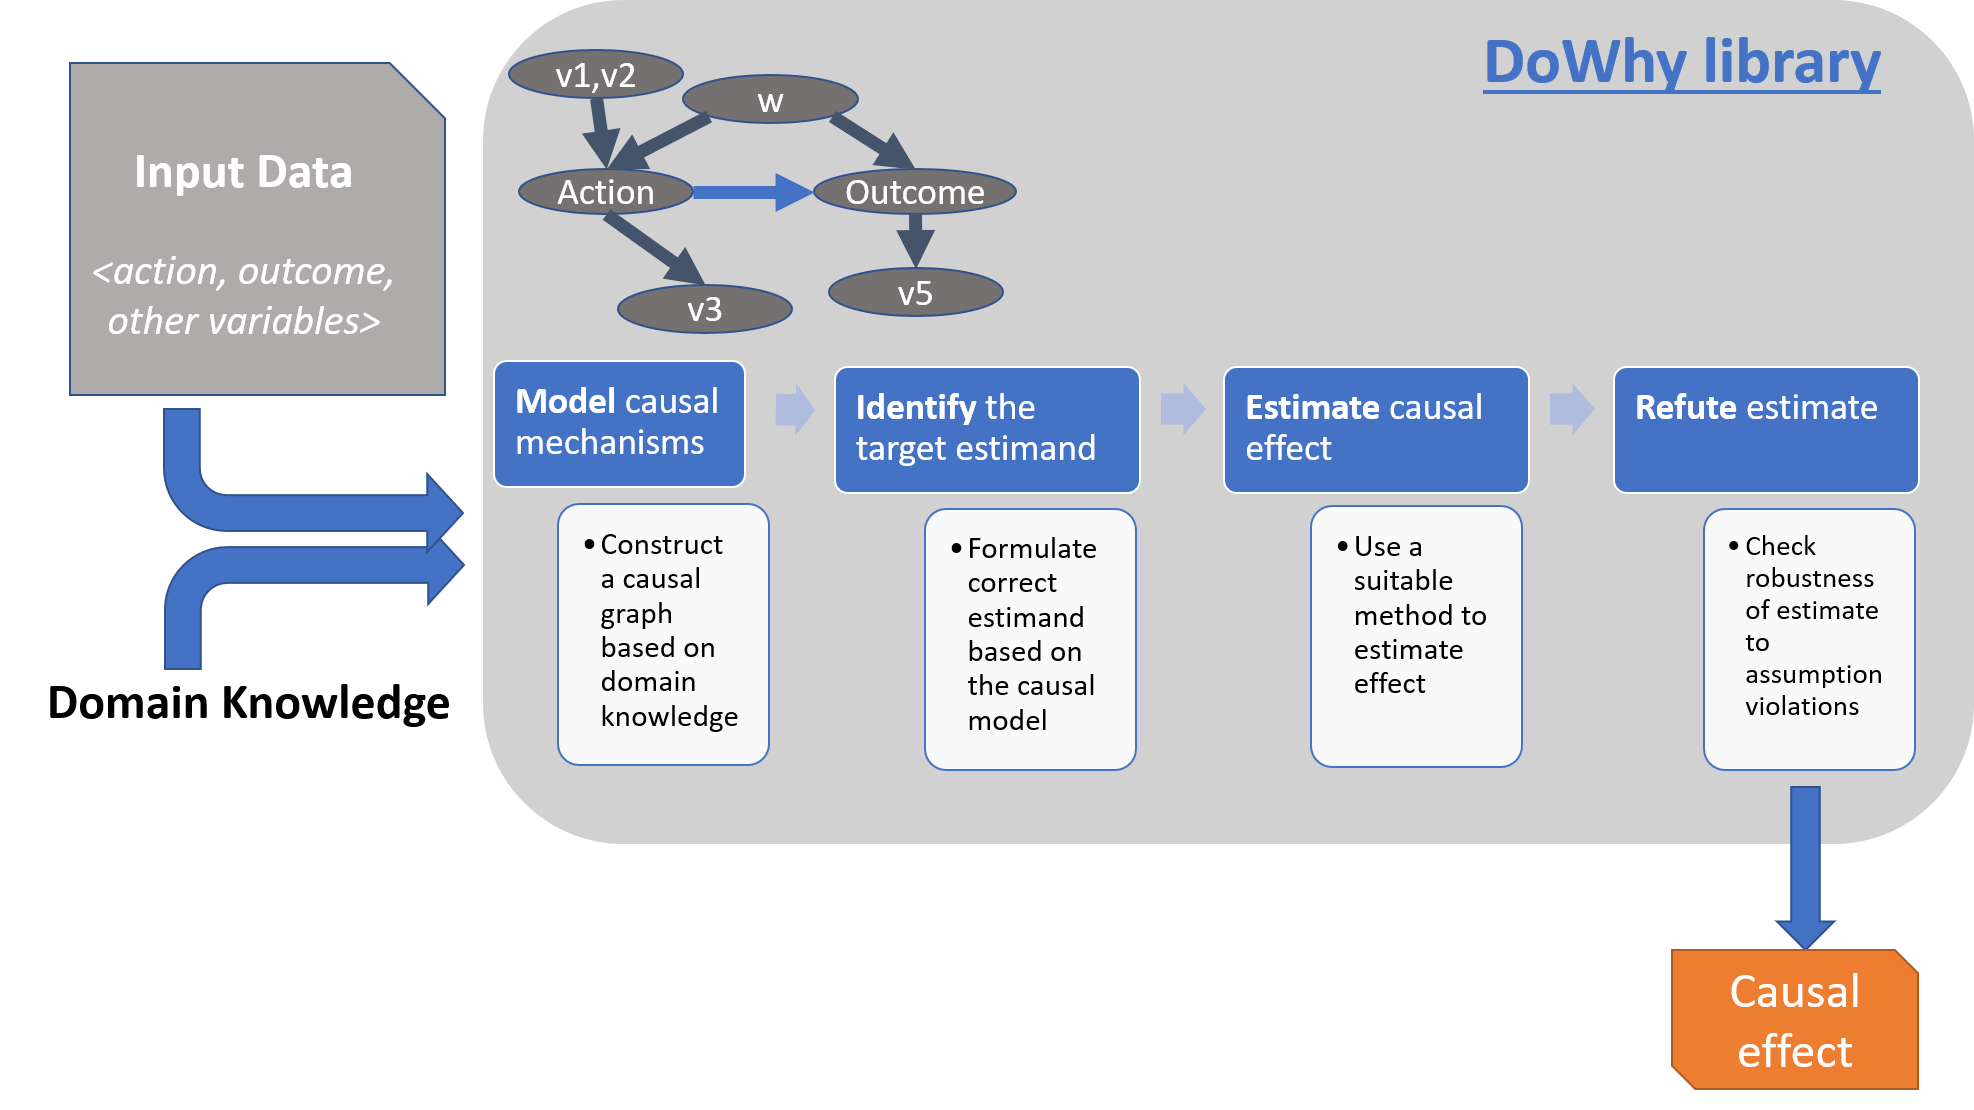
DoWhy is based on a simple unifying language for causal inference. Causal inference may seem tricky, but almost all methods follow four key steps:
Model a causal inference problem using assumptions.
Identify an expression for the causal effect under these assumptions (“causal estimand”).
Estimate the expression using statistical methods such as matching or instrumental variables.
Finally, verify the validity of the estimate using a variety of robustness checks.
This workflow can be captured by four key verbs in DoWhy:
model
identify
estimate
refute
Using these verbs, DoWhy implements a causal inference engine that can support a variety of methods. model encodes prior knowledge as a formal causal graph, identify uses graph-based methods to identify the causal effect, estimate uses statistical methods for estimating the identified estimand, and finally refute tries to refute the obtained estimate by testing robustness to assumptions.
Key differences compared to available causal inference software
DoWhy brings three key differences compared to available software for causal inference:
- Explicit identifying assumptions
Assumptions are first-class citizens in DoWhy.
Each analysis starts with a building a causal model. The assumptions can be viewed graphically or in terms of conditional independence statements. Wherever possible, DoWhy can also automatically test for stated assumptions using observed data.
- Separation between identification and estimation
Identification is the causal problem. Estimation is simply a statistical problem.
DoWhy respects this boundary and treats them separately. This focuses the causal inference effort on identification, and frees up estimation using any available statistical estimator for a target estimand. In addition, multiple estimation methods can be used for a single identified_estimand and vice-versa.
- Automated robustness checks
What happens when key identifying assumptions may not be satisfied?
The most critical, and often skipped, part of causal analysis is checking the robustness of an estimate to unverified assumptions. DoWhy makes it easy to automatically run sensitivity and robustness checks on the obtained estimate.
Finally, DoWhy is easily extensible, allowing other implementations of the four verbs to co-exist (e.g., we support implementations of the estimation verb from EconML and CausalML libraries). The four verbs are mutually independent, so their implementations can be combined in any way.
Below are more details about the current implementation of each of these verbs.
Four steps of causal inference
I. Model a causal problem
DoWhy creates an underlying causal graphical model for each problem. This serves to make each causal assumption explicit. This graph need not be complete—you can provide a partial graph, representing prior knowledge about some of the variables. DoWhy automatically considers the rest of the variables as potential confounders.
Currently, DoWhy supports two formats for graph input: gml (preferred) and dot. We strongly suggest to use gml as the input format, as it works well with networkx. You can provide the graph either as a .gml file or as a string. If you prefer to use dot format, you will need to install additional packages (pydot or pygraphviz, see the installation section above). Both .dot files and string format are supported.
While not recommended, you can also specify common causes and/or instruments directly instead of providing a graph.
Supported formats for specifying causal assumptions
Graph: Provide a causal graph in either gml or dot format. Can be a text file or a string.
Named variable sets: Instead of the graph, provide variable names that correspond to relevant categories, such as common causes, instrumental variables, effect modifiers, frontdoor variables, etc.
Examples of how to instantiate a causal model are in the Getting Started notebook.
II. Identify a target estimand under the model
Based on the causal graph, DoWhy finds all possible ways of identifying a desired causal effect based on the graphical model. It uses graph-based criteria and do-calculus to find potential ways find expressions that can identify the causal effect.
Supported identification criteria
Back-door criterion
Front-door criterion
Instrumental Variables
Mediation (Direct and indirect effect identification)
Different notebooks illustrate how to use these identification criteria. Check out the Simple Backdoor notebook for the back-door criterion, and the Simple IV notebook for the instrumental variable criterion.
III. Estimate causal effect based on the identified estimand
DoWhy supports methods based on both back-door criterion and instrumental variables. It also provides a non-parametric confidence intervals and a permutation test for testing the statistical significance of obtained estimate.
Supported estimation methods
- Methods based on estimating the treatment assignment
Propensity-based Stratification
Propensity Score Matching
Inverse Propensity Weighting
- Methods based on estimating the outcome model
Linear Regression
Generalized Linear Models
- Methods based on the instrumental variable equation
Binary Instrument/Wald Estimator
Two-stage least squares
Regression discontinuity
- Methods for front-door criterion and general mediation
Two-stage linear regression
Examples of using these methods are in the Estimation methods notebook.
Using EconML and CausalML estimation methods in DoWhy
It is easy to call external estimation methods using DoWhy. Currently we support integrations with the EconML and CausalML packages. Here’s an example of estimating conditional treatment effects using EconML’s double machine learning estimator.
from sklearn.preprocessing import PolynomialFeatures
from sklearn.linear_model import LassoCV
from sklearn.ensemble import GradientBoostingRegressor
dml_estimate = model.estimate_effect(identified_estimand, method_name="backdoor.econml.dml.DMLCateEstimator",
                control_value = 0,
                treatment_value = 1,
                target_units = lambda df: df["X0"]>1,
                confidence_intervals=False,
                method_params={
                    "init_params":{'model_y':GradientBoostingRegressor(),
                                   'model_t': GradientBoostingRegressor(),
                                   'model_final':LassoCV(),
                                   'featurizer':PolynomialFeatures(degree=1, include_bias=True)},
                    "fit_params":{}}
                                        )
More examples are in the Conditional Treatment Effects with DoWhy notebook.
IV. Refute the obtained estimate
Having access to multiple refutation methods to validate an effect estimate from a causal estimator is a key benefit of using DoWhy.
Supported refutation methods
Add Random Common Cause: Does the estimation method change its estimate after we add an independent random variable as a common cause to the dataset? (Hint: It should not)
Placebo Treatment: What happens to the estimated causal effect when we replace the true treatment variable with an independent random variable? (Hint: the effect should go to zero)
Dummy Outcome: What happens to the estimated causal effect when we replace the true outcome variable with an independent random variable? (Hint: The effect should go to zero)
Simulated Outcome: What happens to the estimated causal effect when we replace the dataset with a simulated dataset based on a known data-generating process closest to the given dataset? (Hint: It should match the effect parameter from the data-generating process)
Add Unobserved Common Causes: How sensitive is the effect estimate when we add an additional common cause (confounder) to the dataset that is correlated with the treatment and the outcome? (Hint: It should not be too sensitive)
Data Subsets Validation: Does the estimated effect change significantly when we replace the given dataset with a randomly selected subset? (Hint: It should not)
Bootstrap Validation: Does the estimated effect change significantly when we replace the given dataset with bootstrapped samples from the same dataset? (Hint: It should not)
Examples of using refutation methods are in the Refutations notebook. For an advanced refutation that uses a simulated dataset based on user-provided or learnt data-generating processes, check out the Dummy Outcome Refuter notebook. As a practical example, this notebook shows an application of refutation methods on evaluating effect estimators for the Infant Health and Development Program (IHDP) and Lalonde datasets.
Citing this package
If you find DoWhy useful for your research work, please cite us as follows:
Amit Sharma, Emre Kiciman, et al. DoWhy: A Python package for causal inference. 2019. https://github.com/microsoft/dowhy
Bibtex:
@misc{dowhy,
author={Sharma, Amit and Kiciman, Emre and others},
title={Do{W}hy: {A Python package for causal inference}},
howpublished={https://github.com/microsoft/dowhy},
year={2019}
}
Alternatively, you can cite our Arxiv paper on DoWhy.
Amit Sharma, Emre Kiciman. DoWhy: An End-to-End Library for Causal Inference. 2020. https://arxiv.org/abs/2011.04216
Bibtex:
@article{dowhypaper,
title={DoWhy: An End-to-End Library for Causal Inference},
author={Sharma, Amit and Kiciman, Emre},
journal={arXiv preprint arXiv:2011.04216},
year={2020}
}
Roadmap
The projects page lists the next steps for DoWhy. If you would like to contribute, have a look at the current projects. If you have a specific request for DoWhy, please raise an issue.
Contributing
This project welcomes contributions and suggestions. For a guide to contributing and a list of all contributors, check out CONTRIBUTING.md.
Most contributions require you to agree to a Contributor License Agreement (CLA) declaring that you have the right to, and actually do, grant us the rights to use your contribution. For details, visit https://cla.microsoft.com.
When you submit a pull request, a CLA-bot will automatically determine whether you need to provide a CLA and decorate the PR appropriately (e.g., label, comment). Simply follow the instructions provided by the bot. You will only need to do this once across all repos using our CLA.
This project has adopted the Microsoft Open Source Code of Conduct. For more information see the Code of Conduct FAQ or contact opencode@microsoft.com with any additional questions or comments.