Demo for the DoWhy causal API
We show a simple example of adding a causal extension to any dataframe.
[1]:
import os, sys
sys.path.append(os.path.abspath("../../../"))
[2]:
import dowhy.datasets
import dowhy.api

import numpy as np
import pandas as pd

from statsmodels.api import OLS
[3]:
data = dowhy.datasets.linear_dataset(beta=5,
        num_common_causes=1,
        num_instruments = 0,
        num_samples=1000,
        treatment_is_binary=True)
df = data['df']
df['y'] = df['y'] + np.random.normal(size=len(df)) # Adding noise to data. Without noise, the variance in Y|X, Z is zero, and mcmc fails.
#data['dot_graph'] = 'digraph { v ->y;X0-> v;X0-> y;}'

treatment= data["treatment_name"][0]
outcome = data["outcome_name"][0]
common_cause = data["common_causes_names"][0]
df
[3]:
| W0 | v0 | y | |
|---|---|---|---|
| 0 | -1.289334 | False | -3.324194 |
| 1 | -1.100803 | False | -2.035903 |
| 2 | -3.564829 | False | -5.986921 |
| 3 | -2.036167 | False | -2.869478 |
| 4 | -2.781469 | False | -6.127631 |
| ... | ... | ... | ... |
| 995 | -1.178597 | True | 2.965997 |
| 996 | 0.223498 | True | 4.161892 |
| 997 | -2.582064 | False | -3.472824 |
| 998 | -1.998788 | False | -0.725005 |
| 999 | -0.789288 | False | -2.080137 |
1000 rows × 3 columns
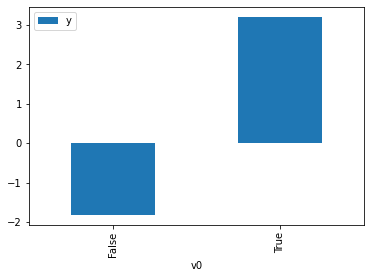
[4]:
# data['df'] is just a regular pandas.DataFrame
df.causal.do(x=treatment,
                     variable_types={treatment: 'b', outcome: 'c', common_cause: 'c'},
                     outcome=outcome,
                     common_causes=[common_cause],
                     proceed_when_unidentifiable=True).groupby(treatment).mean().plot(y=outcome, kind='bar')
WARNING:dowhy.causal_model:Causal Graph not provided. DoWhy will construct a graph based on data inputs.
INFO:dowhy.causal_graph:If this is observed data (not from a randomized experiment), there might always be missing confounders. Adding a node named "Unobserved Confounders" to reflect this.
INFO:dowhy.causal_model:Model to find the causal effect of treatment ['v0'] on outcome ['y']
WARNING:dowhy.causal_identifier:If this is observed data (not from a randomized experiment), there might always be missing confounders. Causal effect cannot be identified perfectly.
INFO:dowhy.causal_identifier:Continuing by ignoring these unobserved confounders because proceed_when_unidentifiable flag is True.
INFO:dowhy.causal_identifier:Instrumental variables for treatment and outcome:[]
INFO:dowhy.causal_identifier:Frontdoor variables for treatment and outcome:[]
INFO:dowhy.do_sampler:Using WeightingSampler for do sampling.
INFO:dowhy.do_sampler:Caution: do samplers assume iid data.
[4]:
<AxesSubplot:xlabel='v0'>
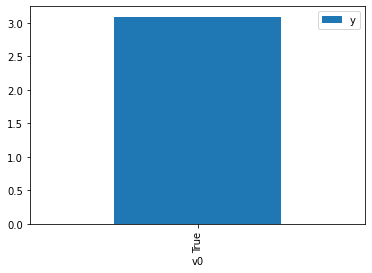
[5]:
df.causal.do(x={treatment: 1},
              variable_types={treatment:'b', outcome: 'c', common_cause: 'c'},
              outcome=outcome,
              method='weighting',
              common_causes=[common_cause],
              proceed_when_unidentifiable=True).groupby(treatment).mean().plot(y=outcome, kind='bar')
WARNING:dowhy.causal_model:Causal Graph not provided. DoWhy will construct a graph based on data inputs.
INFO:dowhy.causal_graph:If this is observed data (not from a randomized experiment), there might always be missing confounders. Adding a node named "Unobserved Confounders" to reflect this.
INFO:dowhy.causal_model:Model to find the causal effect of treatment ['v0'] on outcome ['y']
WARNING:dowhy.causal_identifier:If this is observed data (not from a randomized experiment), there might always be missing confounders. Causal effect cannot be identified perfectly.
INFO:dowhy.causal_identifier:Continuing by ignoring these unobserved confounders because proceed_when_unidentifiable flag is True.
INFO:dowhy.causal_identifier:Instrumental variables for treatment and outcome:[]
INFO:dowhy.causal_identifier:Frontdoor variables for treatment and outcome:[]
INFO:dowhy.do_sampler:Using WeightingSampler for do sampling.
INFO:dowhy.do_sampler:Caution: do samplers assume iid data.
[5]:
<AxesSubplot:xlabel='v0'>
[6]:
cdf_1 = df.causal.do(x={treatment: 1},
              variable_types={treatment: 'b', outcome: 'c', common_cause: 'c'},
              outcome=outcome,
              dot_graph=data['dot_graph'],
              proceed_when_unidentifiable=True)

cdf_0 = df.causal.do(x={treatment: 0},
              variable_types={treatment: 'b', outcome: 'c', common_cause: 'c'},
              outcome=outcome,
              dot_graph=data['dot_graph'],
              proceed_when_unidentifiable=True)
INFO:dowhy.causal_model:Model to find the causal effect of treatment ['v0'] on outcome ['y']
WARNING:dowhy.causal_identifier:If this is observed data (not from a randomized experiment), there might always be missing confounders. Causal effect cannot be identified perfectly.
INFO:dowhy.causal_identifier:Continuing by ignoring these unobserved confounders because proceed_when_unidentifiable flag is True.
INFO:dowhy.causal_identifier:Instrumental variables for treatment and outcome:[]
INFO:dowhy.causal_identifier:Frontdoor variables for treatment and outcome:[]
INFO:dowhy.do_sampler:Using WeightingSampler for do sampling.
INFO:dowhy.do_sampler:Caution: do samplers assume iid data.
[7]:
cdf_0
[7]:
| W0 | v0 | y | propensity_score | weight | |
|---|---|---|---|---|---|
| 0 | -0.782669 | False | -0.792179 | 0.825287 | 1.211700 |
| 1 | -1.386957 | False | -2.541074 | 0.943911 | 1.059422 |
| 2 | -1.704419 | False | -3.922381 | 0.970418 | 1.030484 |
| 3 | -0.814005 | False | -0.313702 | 0.834584 | 1.198202 |
| 4 | 0.029784 | False | -0.307668 | 0.461182 | 2.168343 |
| ... | ... | ... | ... | ... | ... |
| 995 | -0.587235 | False | -0.086199 | 0.757990 | 1.319279 |
| 996 | -0.518178 | False | -0.673428 | 0.730369 | 1.369171 |
| 997 | -0.285695 | False | -2.356726 | 0.624268 | 1.601876 |
| 998 | -1.146594 | False | -4.006878 | 0.910335 | 1.098497 |
| 999 | -1.636781 | False | -4.698411 | 0.966051 | 1.035142 |
1000 rows × 5 columns
[8]:
cdf_1
[8]:
| W0 | v0 | y | propensity_score | weight | |
|---|---|---|---|---|---|
| 0 | -2.094548 | True | 1.099802 | 0.013245 | 75.499593 |
| 1 | -1.584775 | True | 1.996253 | 0.037724 | 26.508238 |
| 2 | -2.287651 | True | -0.454571 | 0.008865 | 112.808679 |
| 3 | -2.287651 | True | -0.454571 | 0.008865 | 112.808679 |
| 4 | -0.427584 | True | 2.698249 | 0.308738 | 3.238989 |
| ... | ... | ... | ... | ... | ... |
| 995 | 1.803262 | True | 8.249998 | 0.979852 | 1.020562 |
| 996 | -0.335329 | True | 4.826016 | 0.351590 | 2.844225 |
| 997 | 0.656759 | True | 8.514054 | 0.813633 | 1.229055 |
| 998 | 0.946281 | True | 5.565004 | 0.889192 | 1.124617 |
| 999 | 0.192547 | True | 3.447829 | 0.621941 | 1.607870 |
1000 rows × 5 columns
Comparing the estimate to Linear Regression
First, estimating the effect using the causal data frame, and the 95% confidence interval.
[9]:
(cdf_1['y'] - cdf_0['y']).mean()
[9]:
$\displaystyle 4.869733164425347$
[10]:
1.96*(cdf_1['y'] - cdf_0['y']).std() / np.sqrt(len(df))
[10]:
$\displaystyle 0.18841744756332976$
Comparing to the estimate from OLS.
[11]:
model = OLS(np.asarray(df[outcome]), np.asarray(df[[common_cause, treatment]], dtype=np.float64))
result = model.fit()
result.summary()
[11]:
| Dep. Variable: | y | R-squared (uncentered): | 0.926 |
|---|---|---|---|
| Model: | OLS | Adj. R-squared (uncentered): | 0.926 |
| Method: | Least Squares | F-statistic: | 6276. |
| Date: | Sat, 05 Dec 2020 | Prob (F-statistic): | 0.00 |
| Time: | 18:02:18 | Log-Likelihood: | -1436.6 |
| No. Observations: | 1000 | AIC: | 2877. |
| Df Residuals: | 998 | BIC: | 2887. |
| Df Model: | 2 | ||
| Covariance Type: | nonrobust |
| coef | std err | t | P>|t| | [0.025 | 0.975] | |
|---|---|---|---|---|---|---|
| x1 | 1.8467 | 0.022 | 82.505 | 0.000 | 1.803 | 1.891 |
| x2 | 5.0277 | 0.067 | 74.507 | 0.000 | 4.895 | 5.160 |
| Omnibus: | 0.268 | Durbin-Watson: | 1.984 |
|---|---|---|---|
| Prob(Omnibus): | 0.874 | Jarque-Bera (JB): | 0.291 |
| Skew: | 0.040 | Prob(JB): | 0.864 |
| Kurtosis: | 2.973 | Cond. No. | 3.02 |
Notes:
[1] R² is computed without centering (uncentered) since the model does not contain a constant.
[2] Standard Errors assume that the covariance matrix of the errors is correctly specified.