Different ways to load an input graph
We recommend using the GML graph format to load a graph. You can also use the DOT format, which requires additional dependencies (either pydot or pygraphviz).
DoWhy supports both loading a graph as a string, or as a file (with the extensions ‘gml’ or ‘dot’).
Below is an example showing the different ways of loading the same graph.
[1]:
import os, sys
import random
sys.path.append(os.path.abspath("../../../"))
[2]:
import numpy as np
import pandas as pd

import dowhy
from dowhy import CausalModel
from IPython.display import Image, display
I. Generating dummy data
We generate some dummy data for three variables: X, Y and Z.
[3]:
z=[i for i in range(10)]
random.shuffle(z)
df = pd.DataFrame(data = {'Z': z, 'X': range(0,10), 'Y': range(0,100,10)})
df
[3]:
| Z | X | Y | |
|---|---|---|---|
| 0 | 1 | 0 | 0 |
| 1 | 6 | 1 | 10 |
| 2 | 4 | 2 | 20 |
| 3 | 7 | 3 | 30 |
| 4 | 9 | 4 | 40 |
| 5 | 3 | 5 | 50 |
| 6 | 5 | 6 | 60 |
| 7 | 2 | 7 | 70 |
| 8 | 8 | 8 | 80 |
| 9 | 0 | 9 | 90 |
II. Loading GML or DOT graphs
GML format
[4]:
# With GML string
model=CausalModel(
data = df,
treatment='X',
outcome='Y',
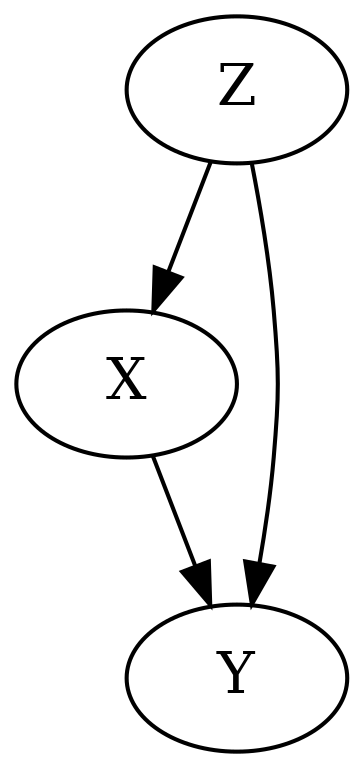
graph="""graph[directed 1 node[id "Z" label "Z"]
node[id "X" label "X"]
node[id "Y" label "Y"]
edge[source "Z" target "X"]
edge[source "Z" target "Y"]
edge[source "X" target "Y"]]"""
)
model.view_model()
display(Image(filename="causal_model.png"))

[5]:
# With GML file
model=CausalModel(
        data = df,
        treatment='X',
        outcome='Y',
        graph="../example_graphs/simple_graph_example.gml"
        )
model.view_model()


display(Image(filename="causal_model.png"))
DOT format
[6]:
# With DOT string
model=CausalModel(
        data = df,
        treatment='X',
        outcome='Y',
        graph="digraph {Z -> X;Z -> Y;X -> Y;}"
        )
model.view_model()

from IPython.display import Image, display
display(Image(filename="causal_model.png"))

[7]:
# With DOT file
model=CausalModel(
        data = df,
        treatment='X',
        outcome='Y',
        graph="../example_graphs/simple_graph_example.dot"
        )
model.view_model()


display(Image(filename="causal_model.png"))
