Identifying Effect using ID Algorithm
This is a tutorial notebook for using the ID Algorithm in the causal identification step of causal inference.
Link to paper: https://ftp.cs.ucla.edu/pub/stat_ser/shpitser-thesis.pdf The pseudo code has been provided on Pg 40.
[1]:
from dowhy import CausalModel
import pandas as pd
import numpy as np
from IPython.display import Image, display
Examples
The following sections show the working of the ID Algorithm on multiple test cases. In the graphs, T denotes the treatment variable, Y denotes the outcome variable and the Xs are additional variables.
Case 1
This example exhibits the performance of the algorithm on the simplest possible graph.
[2]:
# Random data
treatment = "T"
outcome = "Y"
causal_graph = "digraph{T->Y;}"
columns = list(treatment) + list(outcome)
df = pd.DataFrame(columns=columns)

# Causal Model Initialization
causal_model = CausalModel(df, treatment, outcome, graph=causal_graph)

# View graph
causal_model.view_model()
from IPython.display import Image, display
print("Graph:")
display(Image(filename="causal_model.png"))

# Causal Identification using the ID Algorithm
identified_estimand = causal_model.identify_effect(method_name="id-algorithm")
print("\nResult for identification using ID Algorithm:")
print(identified_estimand)
Graph:
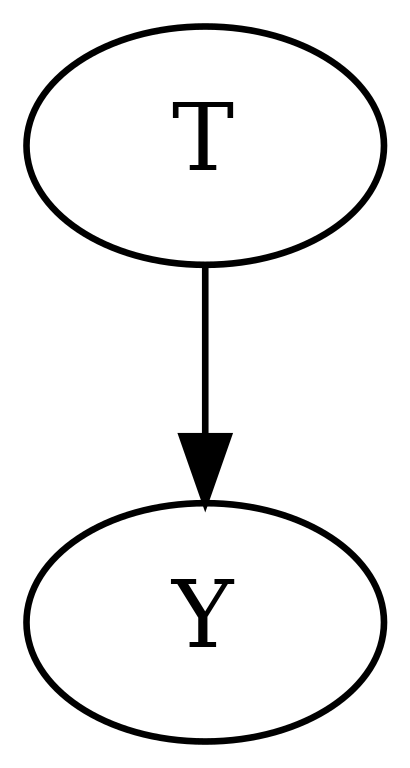
Result for identification using ID Algorithm:
Predictor: P(Y|T)
Case 2
This example exhibits the performance of the algorithm on a cyclic graph. This example demonstrates that a directed acyclic graph (DAG) is needed for the ID algorithm.
[3]:
# Random data
treatment = "T"
outcome = "Y"
causal_graph = "digraph{T->Y; Y->T;}"
columns = list(treatment) + list(outcome)
df = pd.DataFrame(columns=columns)

# Causal Model Initialization
causal_model = CausalModel(df, treatment, outcome, graph=causal_graph)

# View graph
causal_model.view_model()
from IPython.display import Image, display
print("Graph:")
display(Image(filename="causal_model.png"))

try:
    # Causal Identification using the ID Algorithm
    identified_estimand = causal_model.identify_effect(method_name="id-algorithm")
    print("\nResult for identification using ID Algorithm:")
    print(identified_estimand)
except:
    print("Identification Failed: The graph must be a directed acyclic graph (DAG).")
Graph:
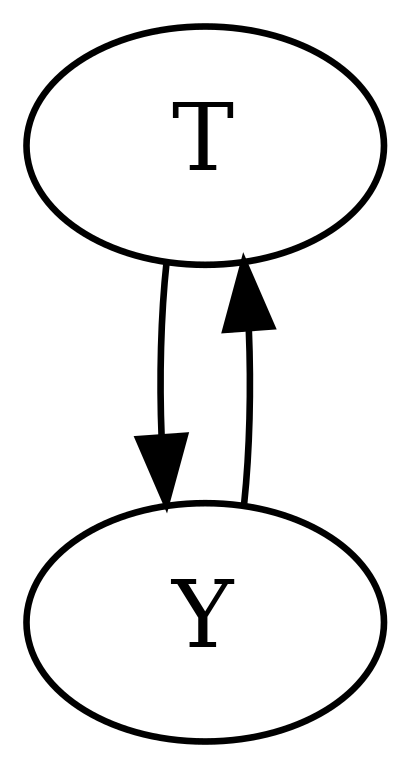
Identification Failed: The graph must be a directed acyclic graph (DAG).
Case 3
This example exhibits the performance of the algorithm in the presence of a mediator variable(X1).
[4]:
# Random data
treatment = "T"
outcome = "Y"
variables = ["X1"]
causal_graph = "digraph{T->X1;X1->Y;}"
columns = list(treatment) + list(outcome) + list(variables)
df = pd.DataFrame(columns=columns)

# Causal Model Initialization
causal_model = CausalModel(df, treatment, outcome, graph=causal_graph)

# View graph
causal_model.view_model()
from IPython.display import Image, display
print("Graph:")
display(Image(filename="causal_model.png"))

# Causal Identification using the ID Algorithm
identified_estimand = causal_model.identify_effect(method_name="id-algorithm")
print("\nResult for identification using ID Algorithm:")
print(identified_estimand)
Graph:
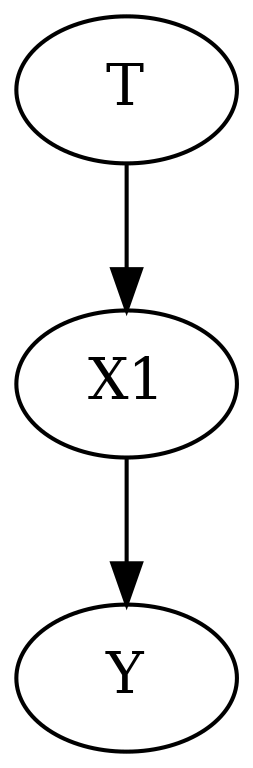
Result for identification using ID Algorithm:
Sum over {X1}:
        Predictor: P(X1|T)
        Predictor: P(Y|T,X1)
Case 4
The example exhibits the performance of the algorithm in the presence of a direct and indirect path(through X1) from T to Y.
[5]:
# Random data
treatment = "T"
outcome = "Y"
variables = ["X1"]
causal_graph = "digraph{T->Y;T->X1;X1->Y;}"
columns = list(treatment) + list(outcome) + list(variables)
df = pd.DataFrame(columns=columns)

# Causal Model Initialization
causal_model = CausalModel(df, treatment, outcome, graph=causal_graph)

# View graph
causal_model.view_model()
from IPython.display import Image, display
print("Graph:")
display(Image(filename="causal_model.png"))

# Causal Identification using the ID Algorithm
identified_estimand = causal_model.identify_effect(method_name="id-algorithm")
print("\nResult for identification using ID Algorithm:")
print(identified_estimand)
Graph:
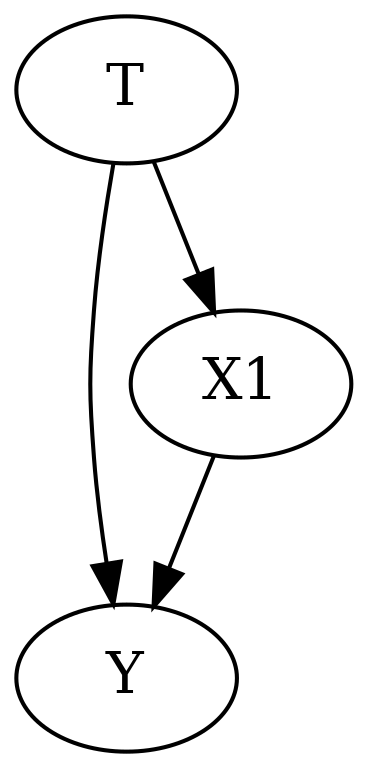
Result for identification using ID Algorithm:
Sum over {X1}:
        Predictor: P(Y|T,X1)
        Predictor: P(X1|T)
Case 5
This example exhibits the performance of the algorithm in the presence of a confounding variable(X1) and an instrumental variable(X2).
[6]:
# Random data
treatment = "T"
outcome = "Y"
variables = ["X1", "X2"]
causal_graph = "digraph{T->Y;X1->T;X1->Y;X2->T;}"
columns = list(treatment) + list(outcome) + list(variables)
df = pd.DataFrame(columns=columns)

# Causal Model Initialization
causal_model = CausalModel(df, treatment, outcome, graph=causal_graph)

# View graph
causal_model.view_model()
from IPython.display import Image, display
print("Graph:")
display(Image(filename="causal_model.png"))

# Causal Identification using the ID Algorithm
identified_estimand = causal_model.identify_effect(method_name="id-algorithm")
print("\nResult for identification using ID Algorithm:")
print(identified_estimand)
Graph:
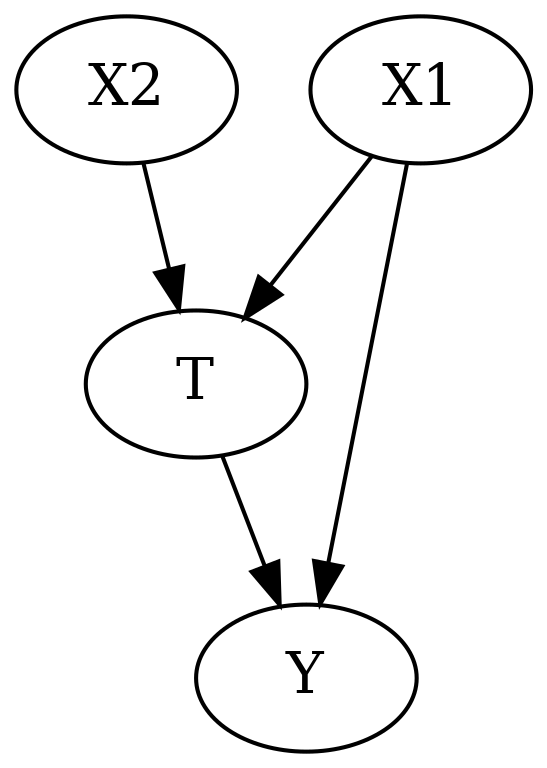
Result for identification using ID Algorithm:
Sum over {X1}:
        Predictor: P(Y|X1,X2,T)
        Predictor: P(X1)
Case 6
This example exhibits the performance of the algorithm in case of a disjoint graph.
[7]:
# Random data
treatment = "T"
outcome = "Y"
variables = ["X1"]
causal_graph = "digraph{T;X1->Y;}"
columns = list(treatment) + list(outcome) + list(variables)
df = pd.DataFrame(columns=columns)

# Causal Model Initialization
causal_model = CausalModel(df, treatment, outcome, graph=causal_graph)

# View graph
causal_model.view_model()
from IPython.display import Image, display
print("Graph:")
display(Image(filename="causal_model.png"))

# Causal Identification using the ID Algorithm
identified_estimand = causal_model.identify_effect(method_name="id-algorithm")
print("\nResult for identification using ID Algorithm:")
print(identified_estimand)
Graph:
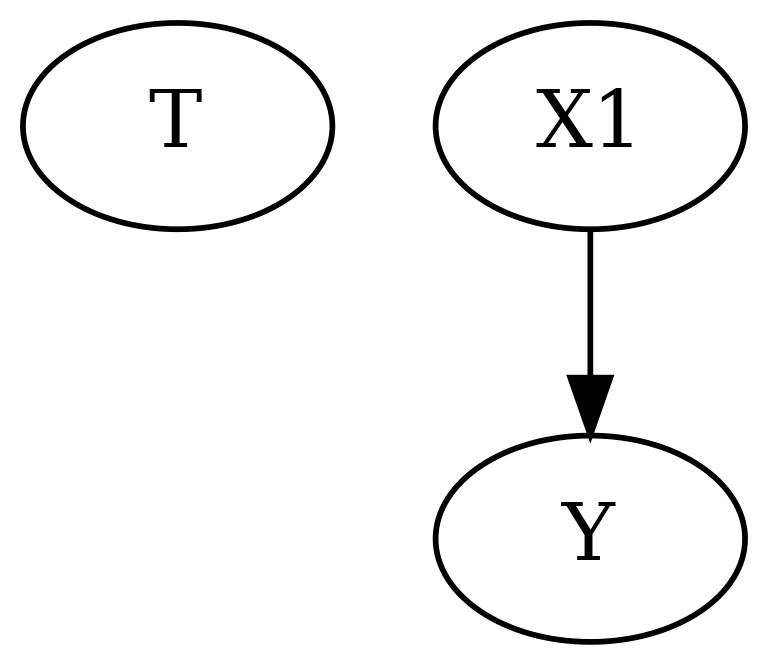
Result for identification using ID Algorithm:
Sum over {X1}:
        Predictor: P(X1,Y)
[ ]: