Modeling Causal Relations#
Except for a couple of exceptions, in DoWhy, the first step to perform a causal task is to model causal relations in form of a causal graph. A causal graph models the causal relations, or “cause-effect-relationships” present in a system or problem domain. This serves to make each causal assumption explicit. Think e.g. altitude → temperature, i.e. higher altitude causes lower temperature. In DoWhy, we require the causal graph to be a directed acyclic graph (DAG) where an edge X→Y implies that X causes Y. Statistically, a causal graph encodes the conditional independence relations between variables.
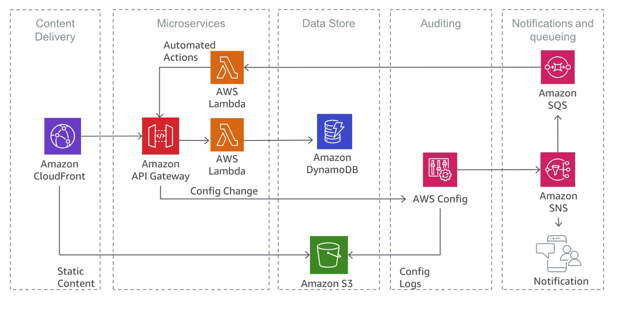
Often, the causal graph can be constructed based on domain knowledge. For example, in a distributed system of microservices, we can use request tracing frameworks to reconstruct the graph of dependencies in that system. Here, the causal graph is the reverse of that dependency graph.
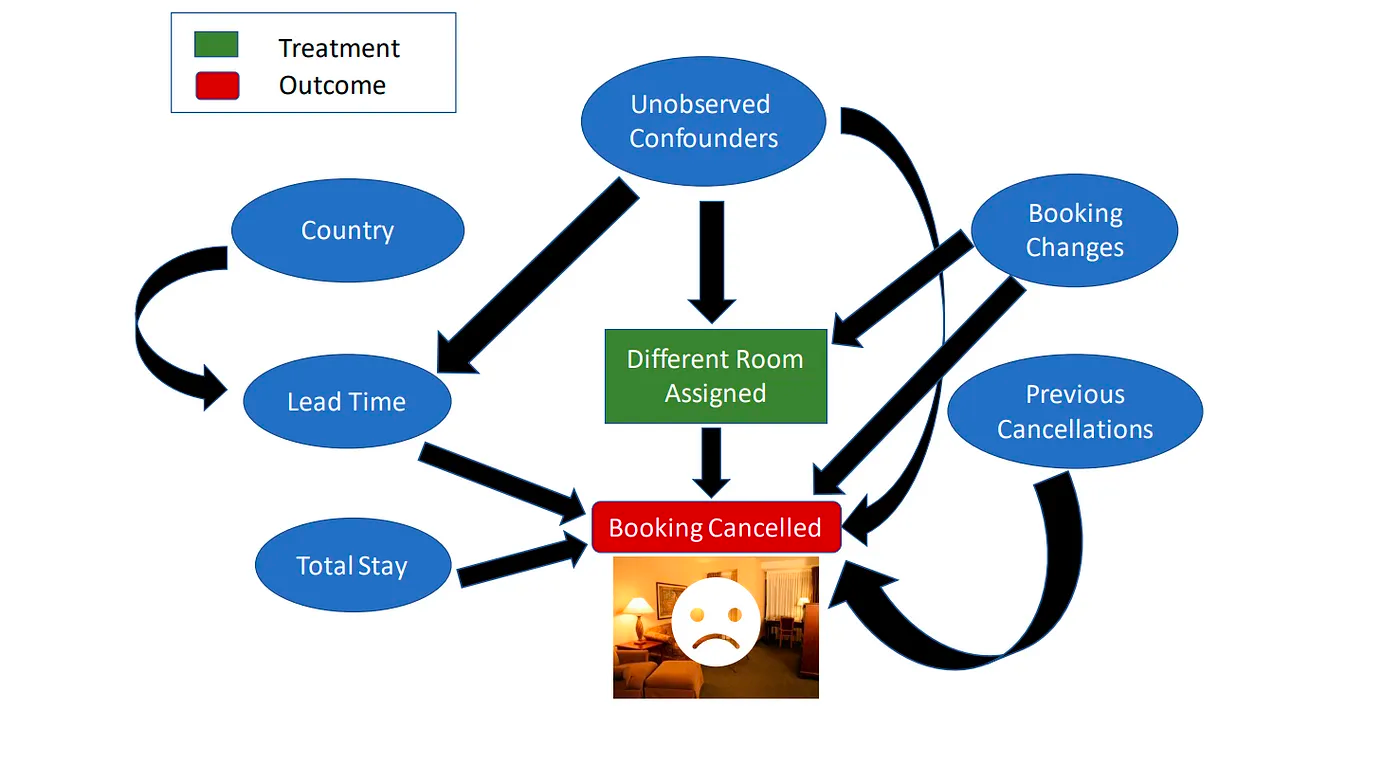
In other cases, such as in understanding the factors driving hotel booking cancellations, we can consult domain experts to learn about the causal graph and construct it.
In cases where we do not know the causal graph, we can apply methods for learning causal structures from data. The section Learning causal structure from data introduces statistical methods for this.
The causal graph is the most important component for most causal tasks since the accuracy of downstream analysis depends on it. To diagnose and potentially reject a causal graph, check out Refuting a Causal Graph and the example notebook Falsification of User-Given Directed Acyclic Graphs. These tests cannot conclude that a graph is valid, but check necessary properties that any valid graph for a dataset should satisfy. As a result, they can be used to refute invalid graphs, help discover errors and improve the graph.
Once we have the causal graph, the next steps are defined by what we want to do:
For effect estimation using specific effect estimators, this is all we need. The next step would be “identification” as explained in Effect Estimation Using specific Effect Estimators (for ACE, mediation effect, …).
For many other tasks, we will also have to assign so-called causal mechanisms to each node as explained in Modeling Graphical Causal Models (GCMs).