Introduction to DoWhy
The need for causal inference
Predictive models uncover patterns that connect the inputs and outcome in observed data. To intervene, however, we need to estimate the effect of changing an input from its current value, for which no data exists. Such questions, involving estimating a counterfactual, are common in decision-making scenarios.
- Will it work?
Does a proposed change to a system improve people’s outcomes?
- Why did it work?
What led to a change in a system’s outcome?
- What should we do?
What changes to a system are likely to improve outcomes for people?
- What are the overall effects?
How does the system interact with human behavior?
What is the effect of a system’s recommendations on people’s activity?
Answering these questions requires causal reasoning. While many methods exist for causal inference, it is hard to compare their assumptions and robustness of results. DoWhy makes three contributions,
Provides a principled way of modeling a given problem as a causal graph so that all assumptions are explicit.
Provides a unified interface for many popular causal inference methods, combining the two major frameworks of graphical models and potential outcomes.
Automatically tests for the validity of assumptions if possible and assesses the robustness of the estimate to violations.
To see DoWhy in action, check out how it can be applied to estimate the effect of a subscription or rewards program for customers [Rewards notebook] and for implementing and evaluating causal inference methods on benchmark datasets like the Infant Health and Development Program (IHDP) dataset, Infant Mortality (Twins) dataset, and the Lalonde Jobs dataset.
Sample causal inference analysis in DoWhy
Most DoWhy analyses for causal inference take 4 lines to write, assuming a pandas dataframe df that contains the data:
from dowhy import CausalModel
import dowhy.datasets

# Load some sample data
data = dowhy.datasets.linear_dataset(
    beta=10,
    num_common_causes=5,
    num_instruments=2,
    num_samples=10000,
    treatment_is_binary=True)
DoWhy supports two formats for providing the causal graph: gml (preferred) and dot. After loading in the data, we use the four main operations in DoWhy: model, estimate, identify and refute:
# I. Create a causal model from the data and given graph.
model = CausalModel(
    data=data["df"],
    treatment=data["treatment_name"],
    outcome=data["outcome_name"],
    graph=data["gml_graph"])

# II. Identify causal effect and return target estimands
identified_estimand = model.identify_effect()

# III. Estimate the target estimand using a statistical method.
estimate = model.estimate_effect(identified_estimand,
                                 method_name="backdoor.propensity_score_matching")

# IV. Refute the obtained estimate using multiple robustness checks.
refute_results = model.refute_estimate(identified_estimand, estimate,
                                       method_name="random_common_cause")
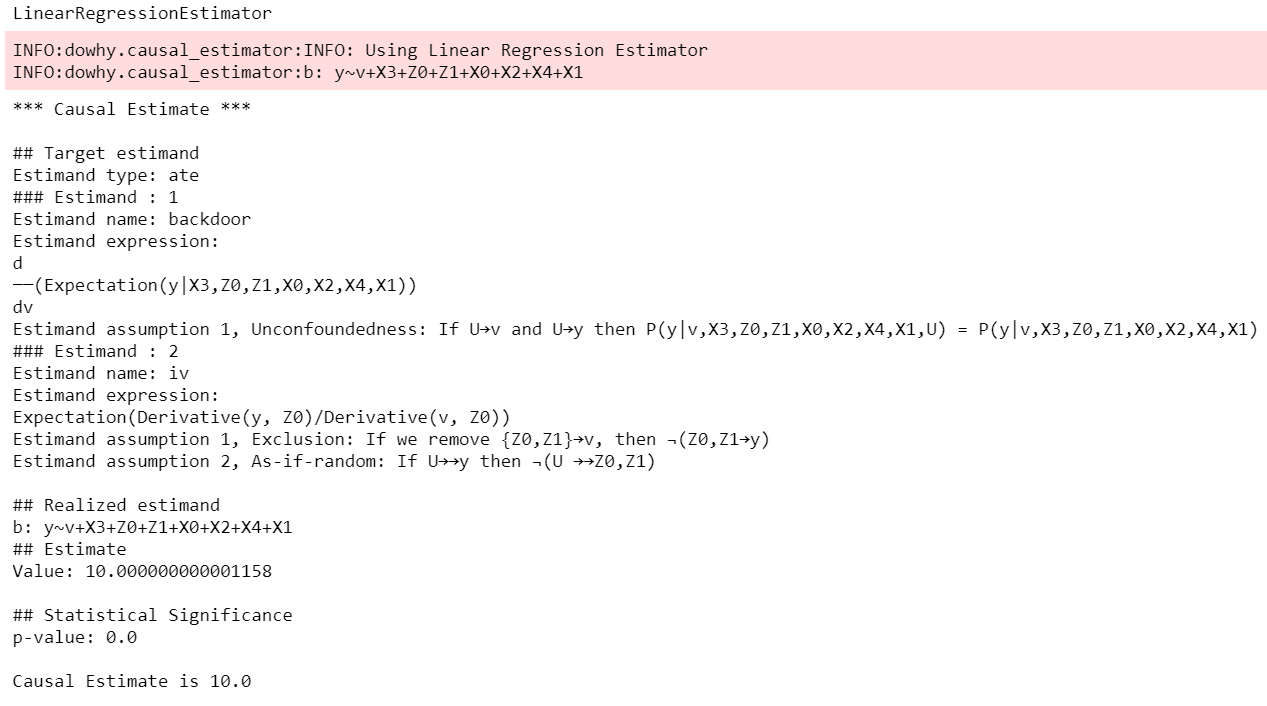
DoWhy stresses on the interpretability of its output. At any point in the analysis, you can inspect the untested assumptions, identified estimands (if any) and the estimate (if any). Here’s a sample output of the linear regression estimator.
For a full code example, check out the Getting Started with DoWhy notebook. You can also use Conditional Average Treatment Effect (CATE) estimation methods from other libraries such as EconML and CausalML, as shown in the Conditional Treatment Effects notebook. For more examples of using DoWhy, check out the Jupyter notebooks in docs/source/example_notebooks or try them online at Binder.
GCM-based inference (experimental)
Graphical causal model-based inference, or GCM-based inference for short, is an experimental addition to DoWhy. For details, check out the documentation for the gcm sub-package. The basic recipe for this API works as follows:
# 1. Modeling cause-effect relationships as a structural causal model
#    (causal graph + functional causal models):
scm = gcm.StructuralCausalModel(nx.DiGraph([('X', 'Y'), ('Y', 'Z')])) # X -> Y -> Z
scm.set_causal_mechanism('X', gcm.EmpiricalDistribution())
scm.set_causal_mechanism('Y', gcm.AdditiveNoiseModel(gcm.ml.create_linear_regressor()))
scm.set_causal_mechanism('Z', gcm.AdditiveNoiseModel(gcm.ml.create_linear_regressor()))

# 2. Fitting the SCM to the data:
gcm.fit(scm, data)

# 3. Answering a causal query based on the SCM:
results = gcm.<causal_query>(scm, ...)
Where <causal_query> can be one of multiple functions explained in Answering Causal Questions.