Introduction
Graphical causal model-based inference, or GCM-based inference for short, is an experimental addition to DoWhy, that currently works separately from DoWhy’s main API. Its experimental status also means that its API may undergo breaking changes in the future. It will be forming a part of a joint, new API. We welcome your comments.
The dowhy.gcm package provides a variety of ways to answer causal questions and we’ll go through them in detail in
section Answering Causal Questions. However, before diving into them, let’s understand
the basic building blocks and usage patterns it is built upon.
If you find the gcm package useful for your work, please cite us as follows:
Bibtex:
@article{dowhy_gcm,
  author = {Bl{\"o}baum, Patrick and G{\"o}tz, Peter and Budhathoki, Kailash and Mastakouri, Atalanti A. and Janzing, Dominik},
  title = {DoWhy-GCM: An extension of DoWhy for causal inference in graphical causal models},
  journal={arXiv preprint arXiv:2206.06821},
  year={2022}
}
The basic building blocks
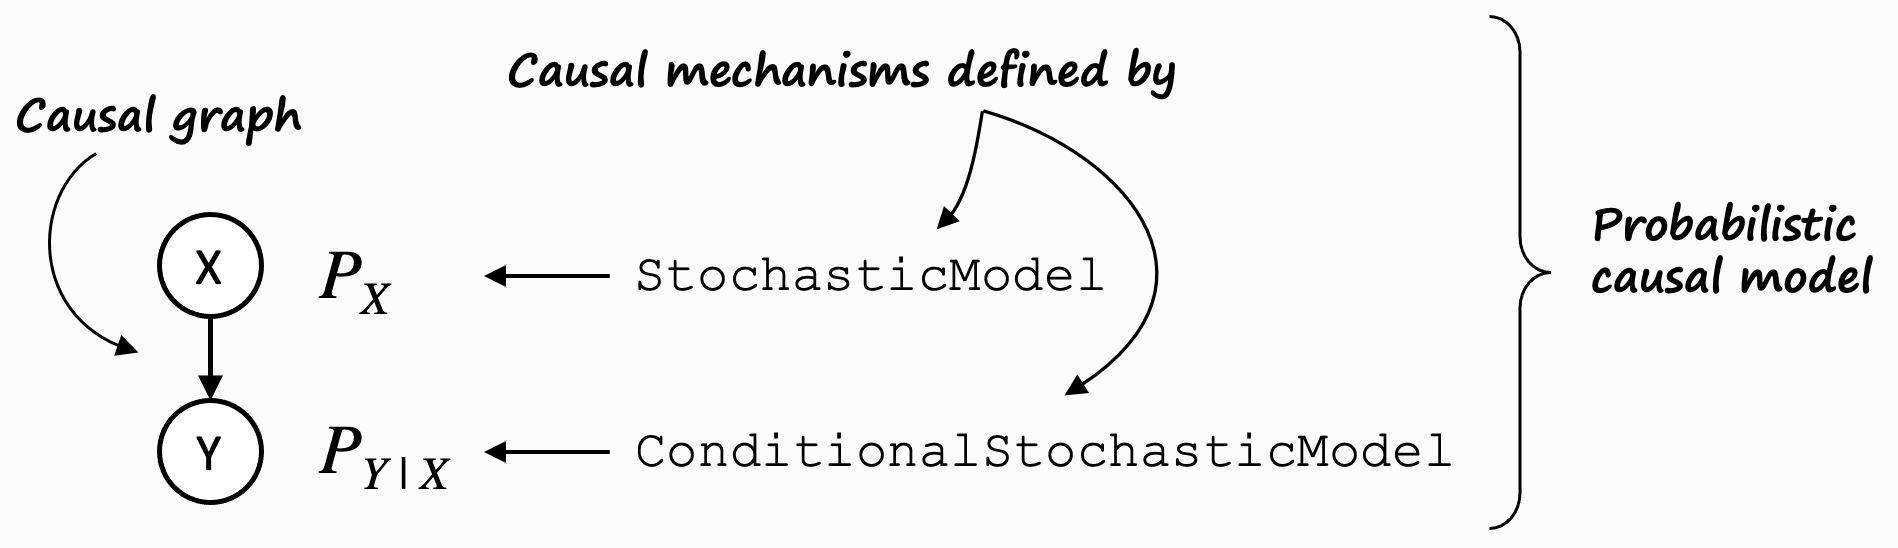
All main features of the GCM-based inference in DoWhy are built around the concept of graphical causal models. A graphical causal model consists of a causal direct acyclic graph (DAG) of variables and a causal mechanism for each of the variables. A causal mechanism defines the conditional distribution of a variable given its parents in the graph, or, in case of root node variables, simply its distribution.
The most general case of a GCM is a probabilistic causal model (PCM), where causal mechanisms are defined by
conditional stochastic models and stochastic models. In the dowhy.gcm package, these are represented by
ProbabilisticCausalModel, ConditionalStochasticModel, and StochasticModel.
In practical terms however, we often use structural causal models (SCMs) to represent our GCMs, and the causal mechanisms are defined by functional causal models (FCMs) for non-root nodes and stochastic models for root nodes. An SCM implements the same traits as a PCM, but on top of that, its FCMs allow us to reason further about its data generation process based on parents and noise, and hence, allow us e.g. to compute counterfactuals.
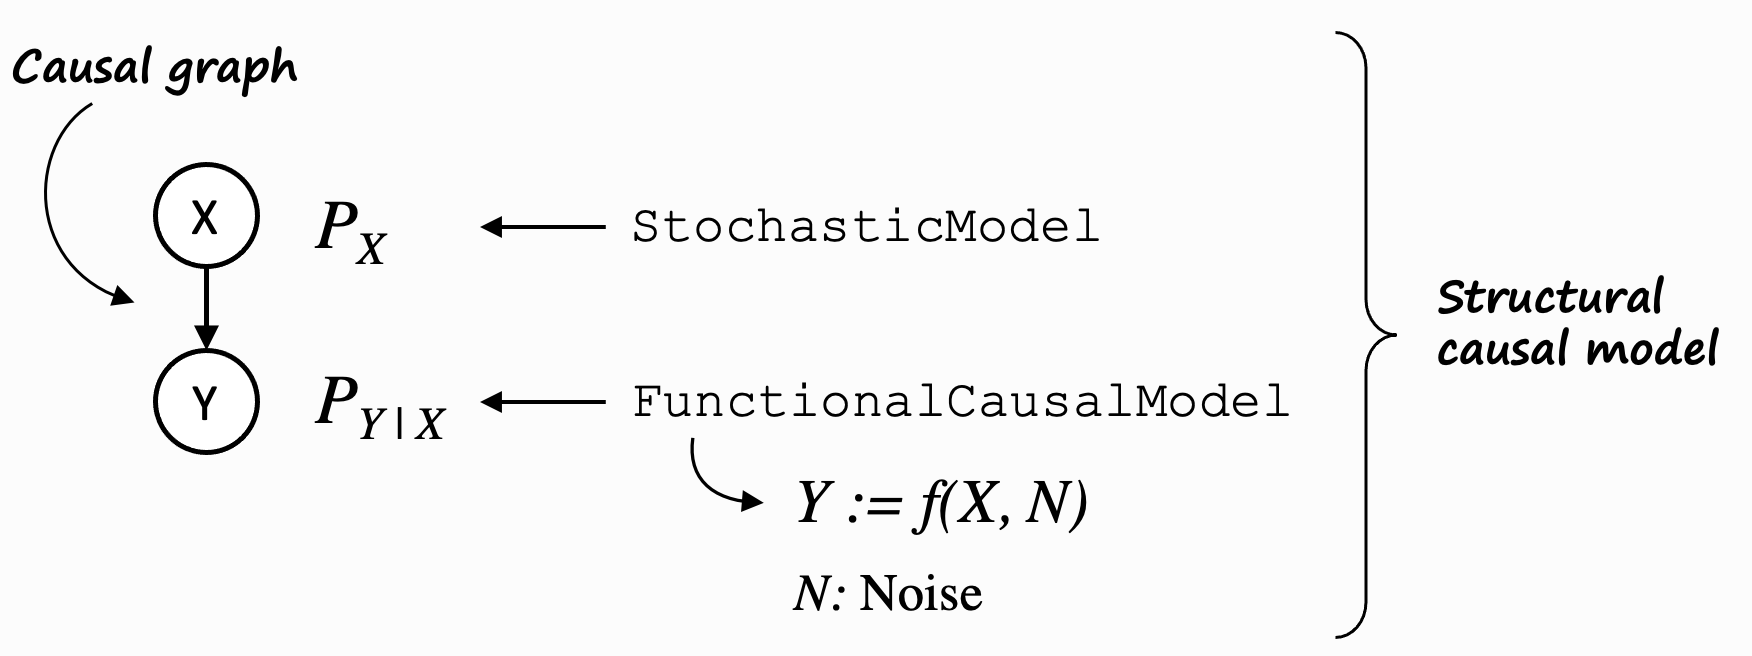
To keep this introduction simple, we will stick with SCMs for now.
As mentioned above, a causal mechanism describes how the values of a node are influenced by the values of its parent nodes. We will dive much deeper into the details of causal mechanisms and their meaning in section Customizing Causal Mechanism Assignment. But for this introduction, we will treat them as an opaque thing that is needed to answer causal questions. With that in mind, the typical steps involved in answering a causal question, are:
1. Modeling cause-effect relationships as a GCM (causal graph + causal mechanisms):
causal_model = StructuralCausalModel(nx.DiGraph([('X', 'Y'), ('Y', 'Z')])) # X -> Y -> Z
auto.assign_causal_mechanisms(causal_model, data)
Or manually assign causal mechanisms:
causal_model.set_causal_mechanism('X', EmpiricalDistribution())
causal_model.set_causal_mechanism('Y', AdditiveNoiseModel(create_linear_regressor()))
causal_model.set_causal_mechanism('Z', AdditiveNoiseModel(create_linear_regressor()))
2. Fitting the GCM to the data:
fit(causal_model, data)
3. Answering a causal query based on the GCM:
results = <causal_query>(causal_model, ...)
Where <causal_query> can be one of multiple functions explained in
Answering Causal Questions.
Let’s look at each of these steps in more detail.
Step 1: Modeling cause-effect relationships as a structural causal model (SCM)
The first step is to model the cause-effect relationships between variables relevant to our use case. We do that in form of a causal graph. A causal graph is a directed acyclic graph (DAG) where an edge X→Y implies that X causes Y. Statistically, a causal graph encodes the conditional independence relations between variables. Using the networkx library, we can create causal graphs. In the snippet below, we create a chain X→Y→Z:
>>> import networkx as nx
>>> causal_graph = nx.DiGraph([('X', 'Y'), ('Y', 'Z')])
To answer causal questions using causal graphs, we also have to know the nature of underlying data-generating process of variables. A causal graph by itself, being a diagram, does not have any information about the data-generating process. To introduce this data-generating process, we use an SCM that’s built on top of our causal graph:
>>> from dowhy import gcm
>>> causal_model = gcm.StructuralCausalModel(causal_graph)
At this point we would normally load our dataset. For this introduction, we generate some synthetic data instead. The API takes data in form of Pandas DataFrames:
>>> import numpy as np, pandas as pd
>>> X = np.random.normal(loc=0, scale=1, size=1000)
>>> Y = 2 * X + np.random.normal(loc=0, scale=1, size=1000)
>>> Z = 3 * Y + np.random.normal(loc=0, scale=1, size=1000)
>>> data = pd.DataFrame(data=dict(X=X, Y=Y, Z=Z))
>>> data.head()
          X         Y          Z
0 -2.253500 -3.638579 -10.370047
1 -1.078337 -2.114581  -6.028030
2 -0.962719 -2.157896  -5.750563
3 -0.300316 -0.440721  -2.619954
4  0.127419  0.158185   1.555927
Note how the columns X, Y, Z correspond to our nodes X, Y, Z in the graph constructed above. We can also see how the values of X influence the values of Y and how the values of Y influence the values of Z in that data set.
The causal model created above allows us now to assign causal mechanisms to each node in the form of functional causal
models. Here, these mechanism can either be assigned manually if, for instance, prior knowledge about certain causal
relationships are known or they can be assigned automatically using the auto module. For the latter,
we simply call:
>>> gcm.auto.assign_causal_mechanisms(causal_model, data)
In case we want to have more control over the assigned mechanisms, we can do this manually as well. For instance, we can can assign an empirical distribution to the root node X and linear additive noise models to nodes Y and Z:
>>> causal_model.set_causal_mechanism('X', gcm.EmpiricalDistribution())
>>> causal_model.set_causal_mechanism('Y', gcm.AdditiveNoiseModel(gcm.ml.create_linear_regressor()))
>>> causal_model.set_causal_mechanism('Z', gcm.AdditiveNoiseModel(gcm.ml.create_linear_regressor()))
Section Customizing Causal Mechanism Assignment will go into more detail on how one can even define a completely customized model or add their own implementation.
In the real world, the data comes as an opaque stream of values, where we typically don’t know how one variable influences another. The graphical causal models can help us to deconstruct these causal relationships again, even though we didn’t know them before.
Step 2: Fitting the SCM to the data
With the data at hand and the graph constructed earlier, we can now train the SCM using fit:
>>> gcm.fit(causal_model, data)
Fitting means, we learn the generative models of the variables in the SCM according to the data.
Step 3: Answering a causal query based on the SCM
The last step, answering a causal question, is our actual goal. E.g. we could ask the question:
What will happen to the variable Z if I intervene on Y?
This can be done via the interventional_samples function. Here’s how:
>>> samples = gcm.interventional_samples(causal_model,
>>>                                      {'Y': lambda y: 2.34 },
>>>                                      num_samples_to_draw=1000)
>>> samples.head()
          X         Y          Z
0  1.186229  6.918607  20.682375
1 -0.758809 -0.749365  -2.530045
2 -1.177379 -5.678514 -17.110836
3 -1.211356 -2.152073  -6.212703
4 -0.100224 -0.285047   0.256471
This intervention says: “I’ll ignore any causal effects of X on Y, and set every value of Y to 2.34.” So the distribution of X will remain unchanged, whereas values of Y will be at a fixed value and Z will respond according to its causal model.
With this knowledge, we can now dive deep into the meaning and usages of causal queries in section Answering Causal Questions.