Visualization of causal graphs#
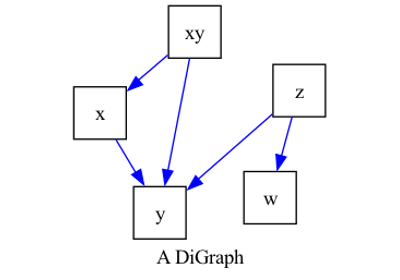
Drawing graphs and setting their layout for visual comparison
Drawing graphs and setting their layout for visual comparison
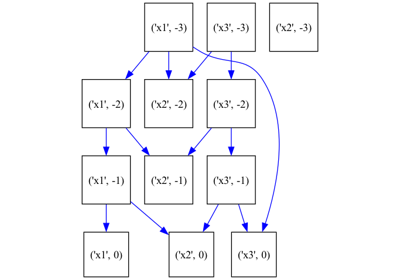
Drawing timeseries graphs and setting their layout
Drawing timeseries graphs and setting their layout